




















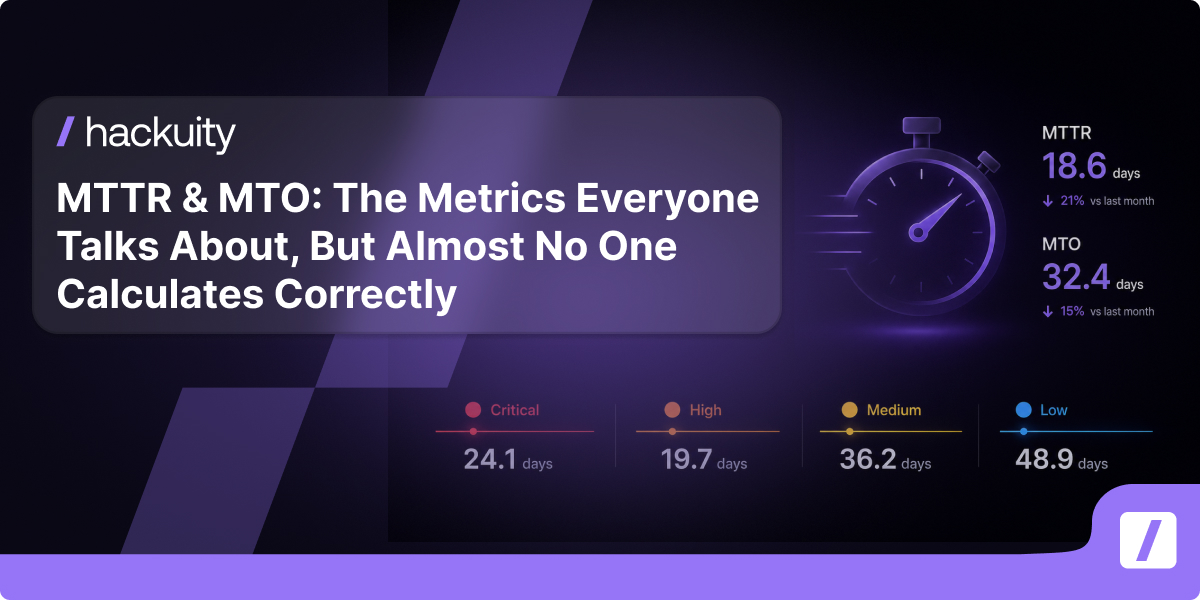
The KPI Your Clients Always Ask First
No matter the industry, no matter the maturity of the organization: when a CISO or security leader reviews their vulnerability management program, they always end up asking the same question.
"How fast are we remediating?"
MTTR (Mean Time To Remediate) and MTO (Mean Time Open) have become de facto standards for measuring the operational effectiveness of Vulnerability Operations teams and MSSPs. They appear in CISO dashboards, board-level reports, and contractual SLA commitments.
And yet, in the vast majority of cases, these metrics are poorly calculated; not technically wrong, but so oversimplified that they become misleading.
The Problem: Metrics Too Coarse to Drive Anything
Most vulnerability management platforms calculate MTTR as a single cumulative figure, without time segmentation or historization to compare periods and measure operational progress.
More critically:
- Regressions and escalations are either ignored or handled with partial rules, generating numbers that don't reflect what teams actually experienced and that they can't defend internally.
- There is no way to drill down and challenge the metric; you get a number, but no path to the findings behind it.
The result? A number that may look reassuring, but does not reflect operational reality. Impossible to use for decision-making, bottleneck identification, or credible SLA commitments.
What is not measured correctly cannot be managed. And what is not managed, worsens.
What Hackuity Rebuilt From the Ground Up
Hackuity has entirely rethought the MTTR and MTO calculation to turn them into genuinely actionable metrics.
MTTR: Measuring What Actually Happened
Monthly historization, by severity
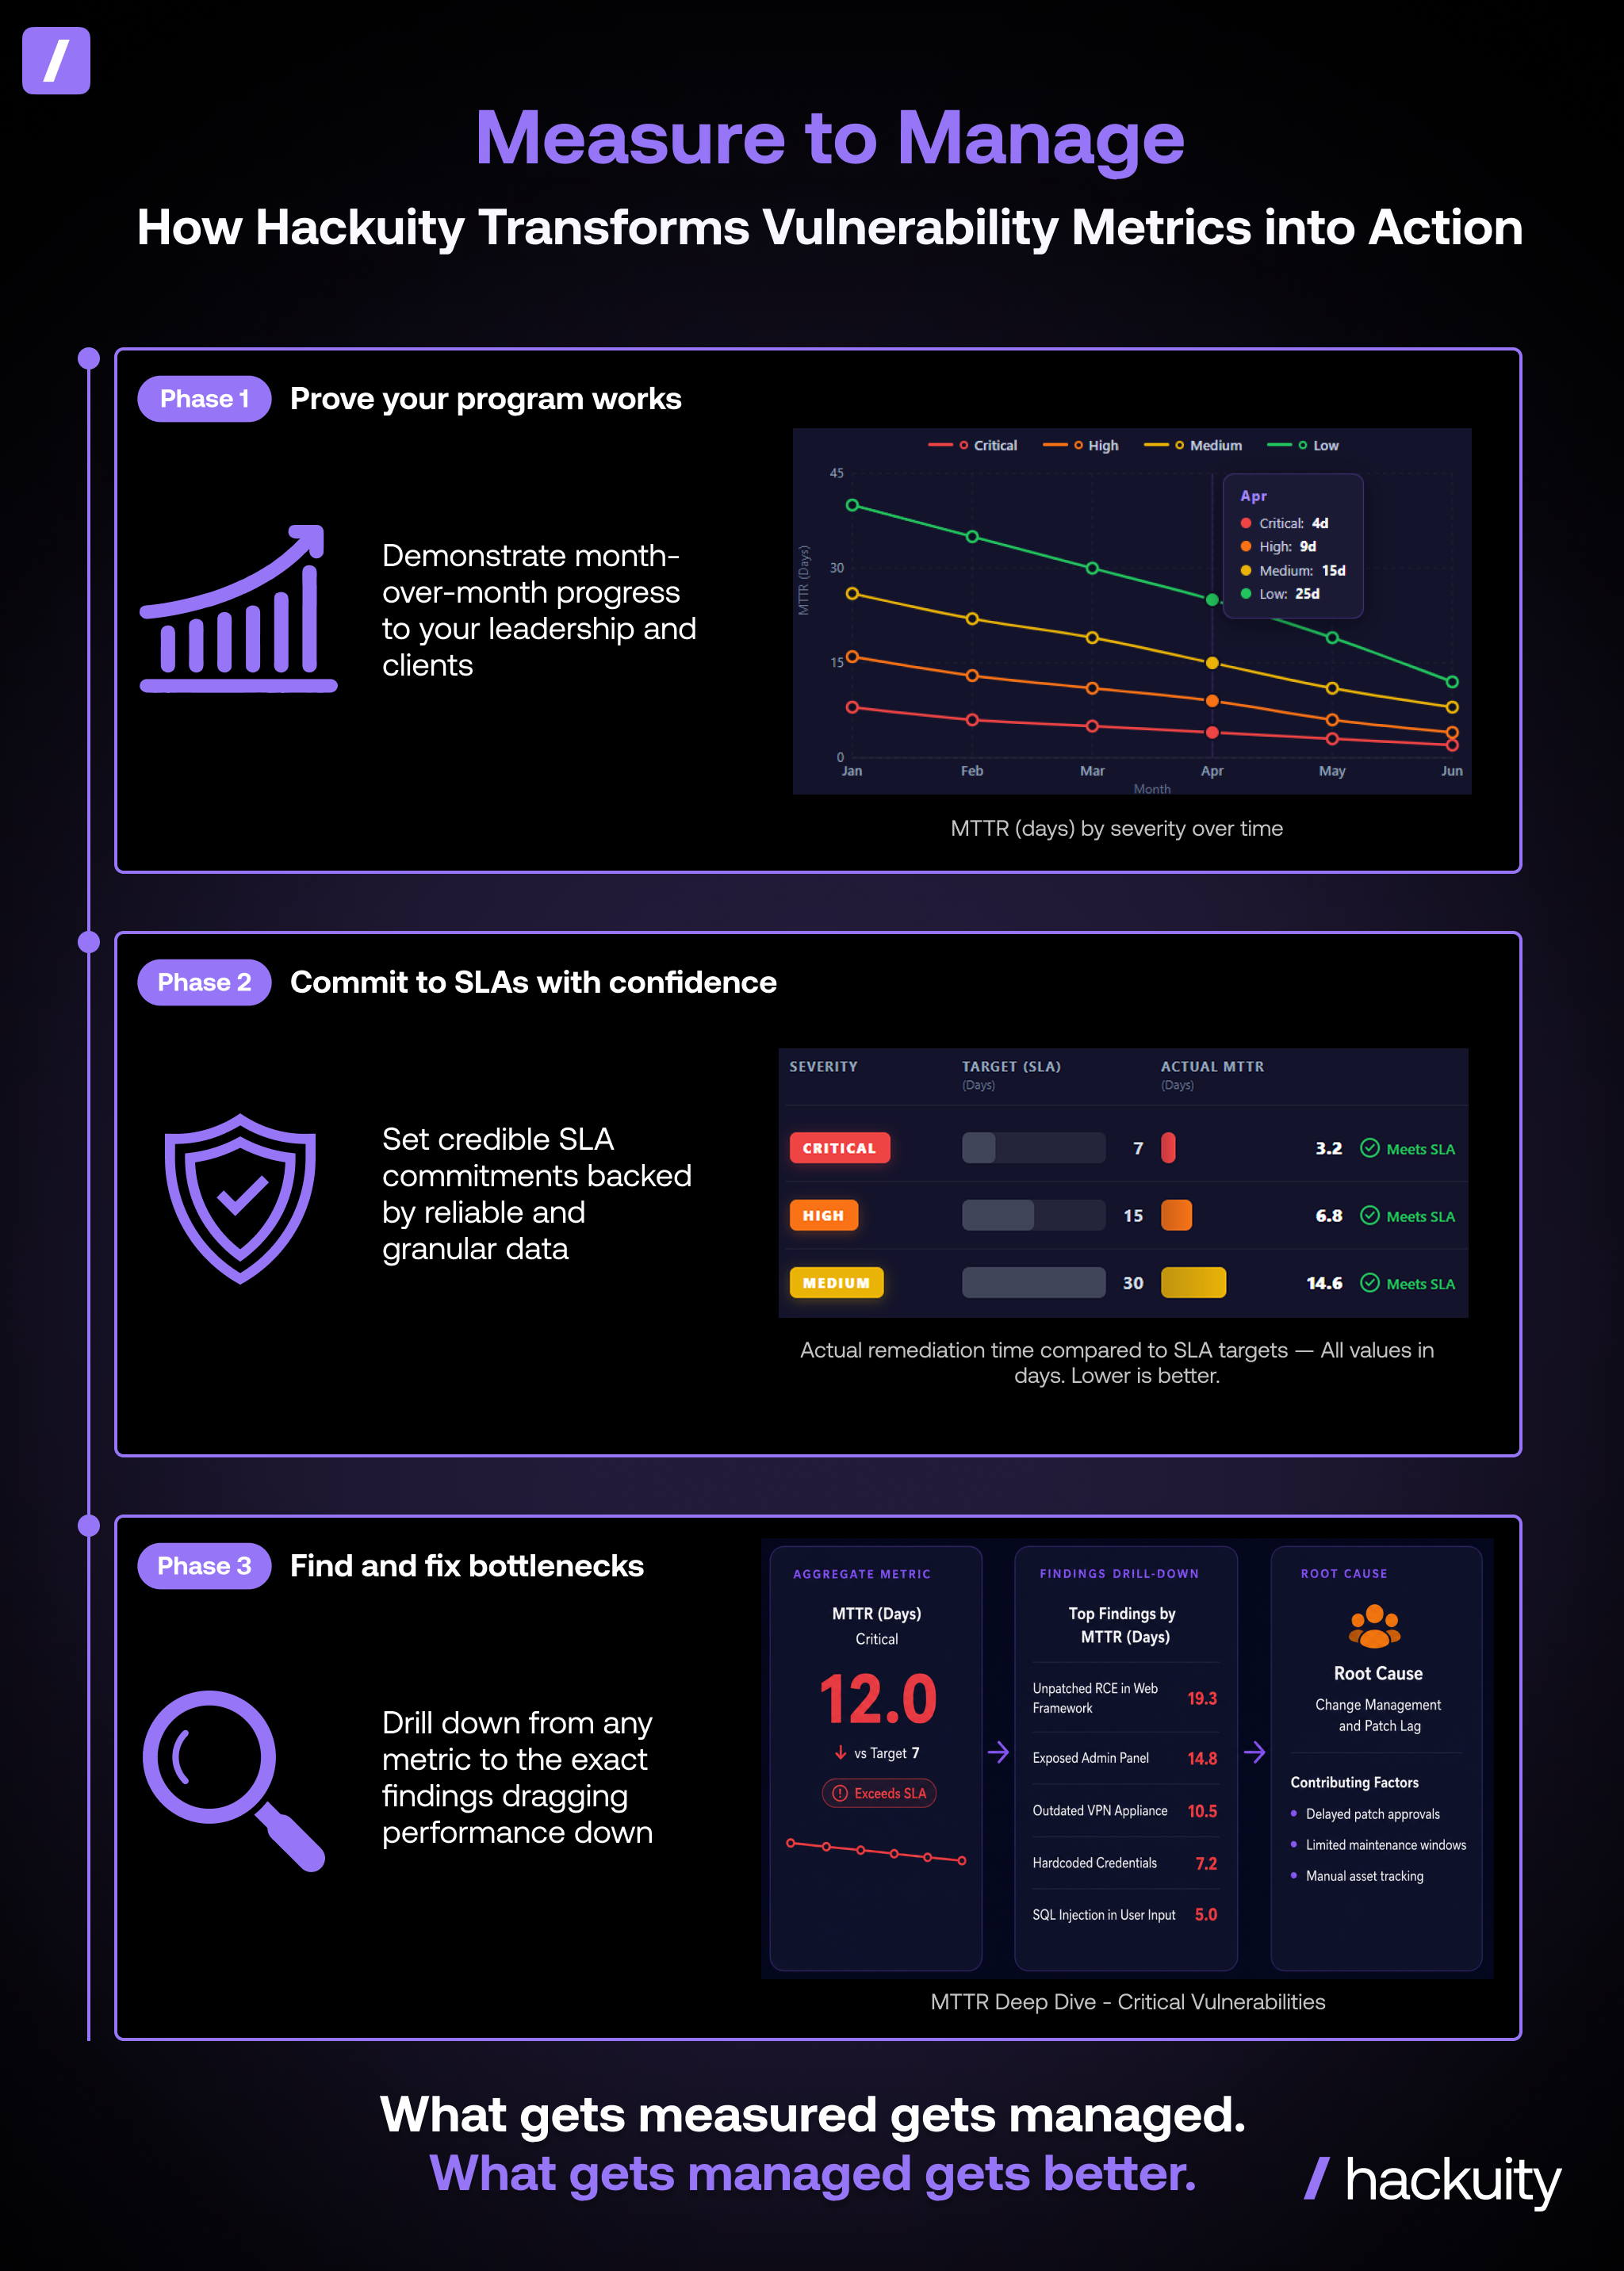
MTTR is now calculated and archived month by month, segmented by severity level (Critical, High, Medium, Low). No more single cumulative figure: you can track trends over time, compare periods, and spot improvements or regressions.
The concept of remediation episodes
This is one of the most important changes. Each open to closed cycle of a finding is an independent episode. If a vulnerability is reopened after closure (regression), the new episode is counted separately. Operational reality is finally respected: a regression is a regression, not an anomaly to hide.
An intelligent start point
The calculation no longer systematically starts from the first detection. The start point is the most recent among:The last severity escalationThe last reopening after closureThe first seenIn practice: a finding disclosed at Medium, left open for 6 months, then escalated to Critical? The Critical MTTR is calculated from the escalation date, not from the beginning. That is the only calculation that makes sense for prioritization and reporting.
Drill-down to take action
Beyond the aggregated figure, Hackuity lets you list precisely the findings that are pulling your MTTR up, identify the teams or perimeters falling behind, and run root cause analysis directly from the metric.
MTO: Quantifying the Real Aging of Open Vulnerabilities
MTO measures the average time vulnerabilities remain open (= unresolved). It is a risk exposure indicator over time.
Here too, Hackuity goes further than the competition on two key points:
Monthly historization by severity
Like MTTR, MTO is calculated month by month and by severity level. You can see whether your Criticals are aging, whether your Highs are accumulating, and whether the trend is improving or deteriorating.
Separate tracking per severity level reached
This is the most differentiating point: if a finding was successively Medium then Critical, its exposure time is tracked separately for each severity level. You know how long it was open at Medium severity, and how long at Critical severity.
This is not a detail: it is what allows you to measure the real impact of an escalation on your risk exposure.
Why This Is Structurally Differentiating for VOC
Teams and MSSPs
For a Vulnerability Operations team or an MSSP, these metrics are not just reporting indicators. They sit at the heart of three critical challenges:
1. Proving the value of the remediation program
Your clients no longer just want to know how many vulnerabilities were handled. They want to know whether the program is improving. An MTTR trending down month over month, by severity, is tangible proof that the work is paying off.
2. Committing to credible SLAs
A properly calculated MTTR allows you to commit to remediation timelines by severity and to track adherence to those commitments. Without this granularity, the SLA becomes an unverifiable promise.
3. Identifying bottlenecks and prioritizing action
The drill-down by finding, by team, by perimeter transforms an aggregated metric into an investigation tool. You no longer just look at the number, you act on what drives it.
What Gets Measured Gets Managed.
What Gets Managed Gets Better.
Vulnerability management is a continuous operational process. Like any process, it improves when measured correctly, when friction points are identified, and when progress can be demonstrated.
MTTR and MTO, calculated with the rigor they deserve, are the management tools that teams have been missing to move from a reactive posture to a truly managed one.
That is what we built at Hackuity.
How do you measure your MTTR today? Do you commit to remediation SLAs with your clients or leadership? Would love to hear your thoughts.



VR-1 | Property |
|---|---|
Model type | Post-trained cyber reasoning model |
Primary specialization | Multi-domain enterprise attack-chain discovery |
Starting condition | A scoped foothold and a concrete objective |
Operating surfaces | Cloud, identity, runtime, code, CI/CD, SaaS, and organizational context |
Success signal | Execution-verified completion of the objective |
Primary evaluation | IntrusionBench |
Preliminary result (preview) | More than 2× black-box pass@3 over the strongest evaluated frontier baseline |
Trajectory budget | Two-hour wall-clock limit per trajectory, or 250 agent turns (whichever comes first) |